Custom dashboards are a powerful feature of Insights that let you build exactly the dashboard that you want to see. You can also schedule reports to be sent based on a custom dashboard.

Creating a custom dashboard

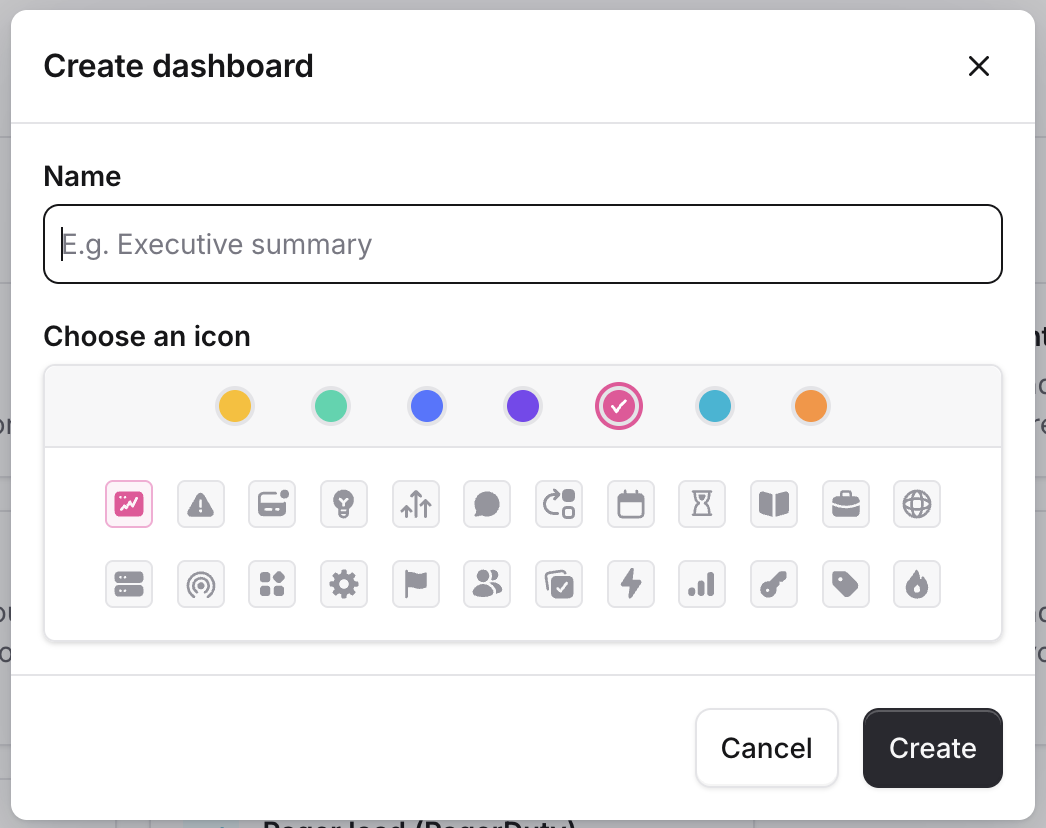
To create a new custom dashboard, go to the Insights homepage, and click the “Create dashboard” button in the top right. Create dashboard dialog with a Name field, Choose an icon swatches and a Create button Give your custom dashboard a name, choose an icon and color, and then click Create.
Adding panels

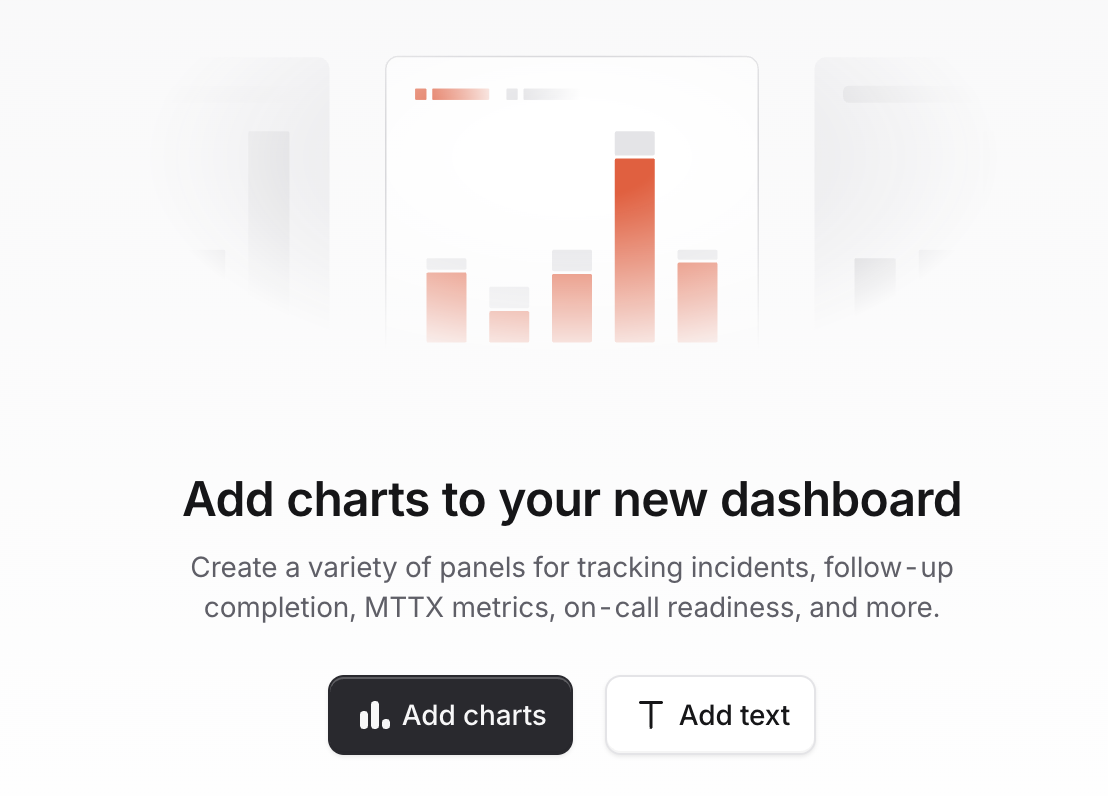
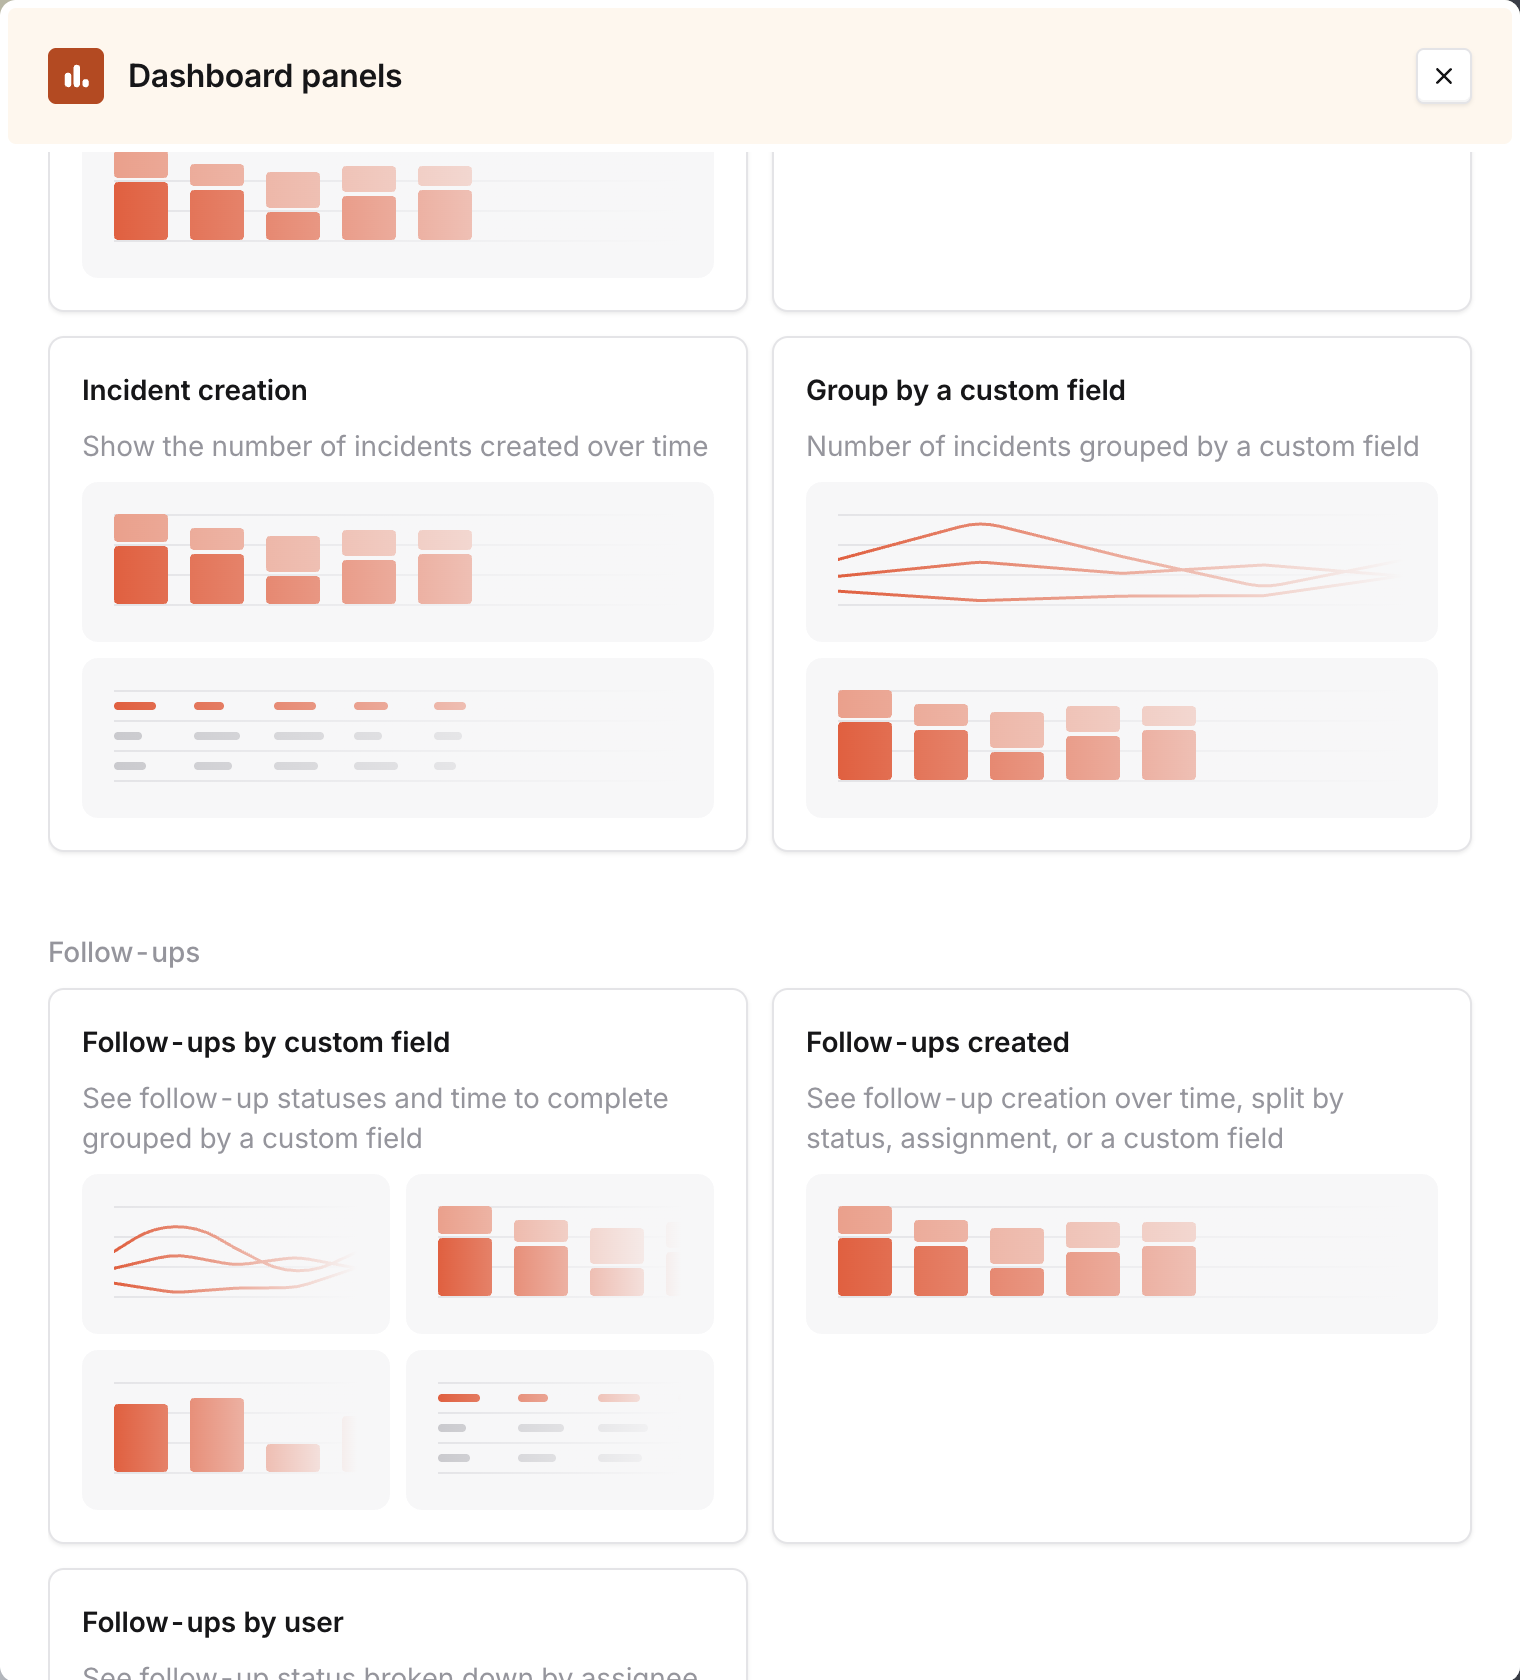
You can add panels containing either charts or text to your custom dashboard, simply click the corresponding button on your empty dashboard: An empty dashboard prompting Add charts or Add text You can add any panel from one of the core insights dashboards to your custom dashboard by selecting it from the drawer: The Dashboard panels drawer, listing panels such as Incident creation and Follow-ups created
Filtering the whole dashboard

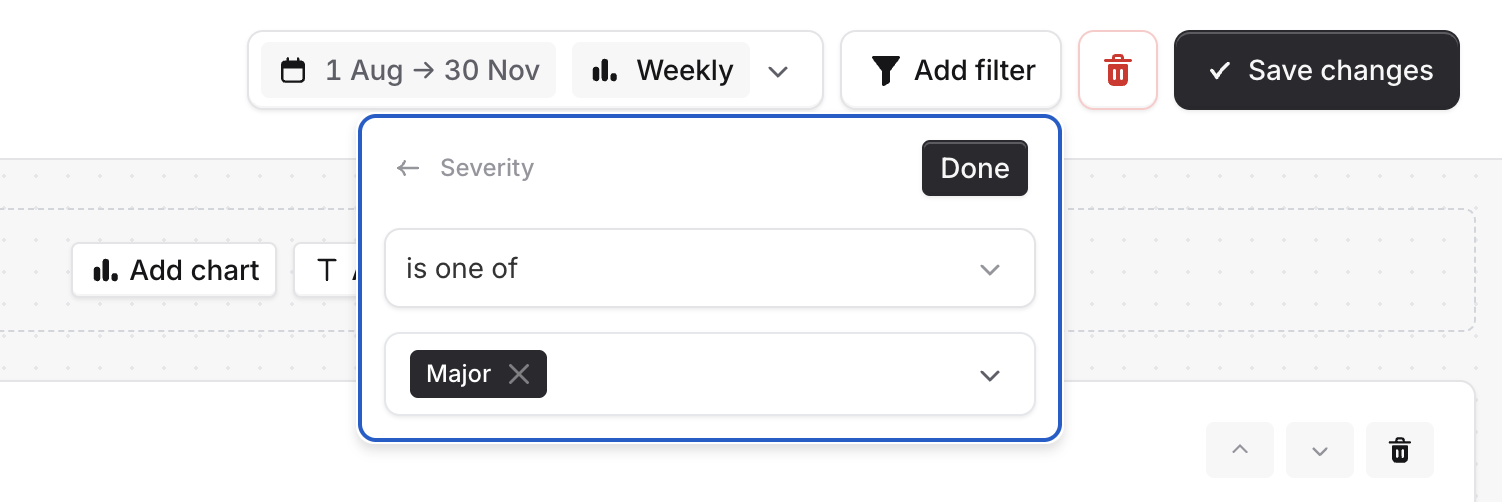
You can add filters to the dashboard, and they will affect all panels on the dashboard. For example, you can filter so that you only see data for major incidents by using the “Add filter” button in the header bar: The dashboard header Add filter popover set to Severity is one of Major
Filtering a panel

If you want to filter just a single panel in a custom dashboard, click the “Add filter” button in the header of the panel you want to filter: A single panel header filtered to Incident Type is one of Build failures The filters you add to a panel will be applied in addition to the filters that are added to the whole dashboard.
